I am not a certified analyst. The charts shown and the content in the blog are for educational purpose only and in no way is a buy or sell recommendation. Readers are advised to use discretion.
Showing posts with label Bollinger Bands. Show all posts

Thursday, 10 March 2016

Nifty Outlook for March '16

Nifty Outlook:   Just looking at the daily BB, i am surprised and analysing why? Just few points to ponder..
- Why NS didn't test UBB last 3 times?
- Why NS do test UBB this time?
- Why a Deep fall of 5 days was followed by a Big rally of 5 days?
All this is making me think that Downtrend is feeling a Pause right now and Nifty is gonna move further Up after this COBB.
I would expect a correction till Monday/ Tuesday for a Flip retest and to continue this Uptrend for 7700 - 8000 NS.
Positional Shorts are closed as mkt not supporting and longs will be initiated again at some Flip -  7375 - 7225 NS..

Saturday, 2 January 2016

How to Locate Strong Setups -4 !!

(SS) Strong Setups Series - 4

So now we have 2 things clear -
1) Bias
2) Squeeze formation

If not clear, plz re-read again and then move on to the Trigger- The Entry Pattern !

As we are looking for only strong setups, so we will get lesser opportunities with high strike rate ! so its worth waiting

Now when the squeeze is evident, Mark two DP zones (Support / Resistance) - One on the Pivot high before squeeze, another on the Pivot Low of Squeeze start.
For our entry, we should be looking for a candle formation on UBB or LBB touching this DP. If the Bias is Up, then look for a candle formation on UBB first then on LBB and Vice Versa. 
Any candlestick pattern you love - like Engulfing, Hammer, Doji... whatever the names are (and i am least bothered about it), it should have break of UBB with few points and then moved to LBB. 
The candle can be bigger or can be smaller.. It can be with high volume or low volume.. we seriously don't need these things, all we need is a breakout of UBB followed by breakout of LBB in a Squeeze with Up bias. Yupp, DP touch is a must !!
Let me give an example here with Nifty 15 min chart- In an Up Bias, 2 squeeze are formed..


(1) First touch to UBB + DP. we are waiting for LBB touch
(2) Second touch to LBB + DP. 
Now any RED Candle High break is our Entry with SL below it.
(3) First Touch to DP, but not BB so avoid
(4) First touch to UBB + DP, wait for LBB
(5) Second touch to LBB + DP. Any Red candle High break is our entry !!

Watch the Entry candles below marked with pink circles..


Just practice this, and will come up with Targets/ Money Management & few Situations to avoid...

Saturday, 26 December 2015

How to Locate Strong Setups -3 !!

(SS) Strong Setups Series - 3

Now you can know the bias of market -Up/ Down Sideways, what's next?

Next is my favourite Bollinger Bands.. We should use default settings of Bollinger Bands (20,2) as i am of the view, we should see what all people are looking at & infer with same information.

We are not gonna use any other kind of Support Resistance.. Lets keep the chart as cleaner as possible..

2nd Rule - Wait for BB Squeeze. but the challenge is to identify the squeeze. It looks like marked in below Nifty 15 min chart. Plz go through below questionnaire after the chart to get some clarification..


- What is the squeeze exactly ?? - When both of the Bollinger bands come nearer to each other and both BB are Flattish -neither Up or down (lesser than 20 degrees angle approx.. yeah yeah,, no need to measure with a protector, use naked eye). See the BB as marked above.

- How much nearer is nearer?? - Just have a look at the past candles & BB behaviour. From a bigger volatility, the mkt must have come to little volatility. Some people use ATR (14) for the purpose, but i like naked BB.

- When should we say the squeeze have started?? - When more than 5 candles formation is completed without touching any of the BB, we can say our desired Squeeze has started. Below Nifty 30 min chart has just formed one !!


- Shall we enter on break of Squeeze on touch or a Close outside BB (COBB) ?? - NOOOO, You will be Trapped !!

Will get back with few more examples & the Entry Pattern .. till then keep looking and analysing old Squeezes.. Its Fun to see how much it forms and how much time the mkt is in it especially in lower time frames...

Tuesday, 1 December 2015

How to Locate Strong Setups -2 !!

(SS) Strong Setups Series - 2

Hey All, I am back after a long break !!  Hope everyone is doing great ..

Lets come back to Business ! Strong Setups-  For me, Price & Bollinger is all it requires to locate them. I am an intraday Nifty player, so will be fetching the charts of max 30 mins..  

1) Base of the Strong setups is to identify your Bias- Up or Down (yes No Sideways). We don't need any stupid thing to identify Trend.. If The Price is at the Right Upper edge of chart its Uptrend & if Price is at Right Lower edge, its Downtrend. Keep it Dirt simple !!

Lets see in below charts- One is Daily Chart & next is 15 min Nifty chart-


I am not gonna tell the answer, You are absolutely Right !! That's it, Is it too difficult to identify trend?  This gives us our 1st Rule- We will trade only in Trend direction for High probability strong setups, till our 1st Stop Loss gets hit, YES,  till our 1st Stop Loss gets Hit. Trading is Painful journey, Embrace.. 
(Though we will reduce this SL hitting chances considerably, but be prepared for all consequences)
This SL hitting really works, this helps in getting in each & every setup without any doubt, thereby increasing the effectiveness of system.
Trading is a probability game. If you will not take each & every trade, till you click the counter upto 30, you will eventually stuck in Bad trades & will loose the Best Ones  cursing ME :(

Now fetch some of the stock charts & check the trend thinking what should had been done today  trading them !

Sunday, 12 July 2015

How to Locate Strong Setups !!

(SS) Strong Setups Series - 1

A lot of People ask me -"How to locate a Trade setup !!"  I always tell them, setups are everywhere, which can be traded also, but one should wait for a Strong trade Setup! That is more important !

Now the question is still Open - Which setups are Strong?

--This can't be put in a single post, so will try to explain in a series of posts.. Kindly have patience & go through with me in this whole journey, you will find it interesting & profitable too ! It will be written taking into consideration of novice traders with basic knowledge. I will try to analyze the live market setups (positional with the system). Lets see how it unfolds --

Lets start from a different angle-  Traders.
Every Trader is different. Each trader is unique with Unique personality, monetary needs, different trade size, risk capacities, Psychology, Fear levels, satisfaction levels, indicators & so on.
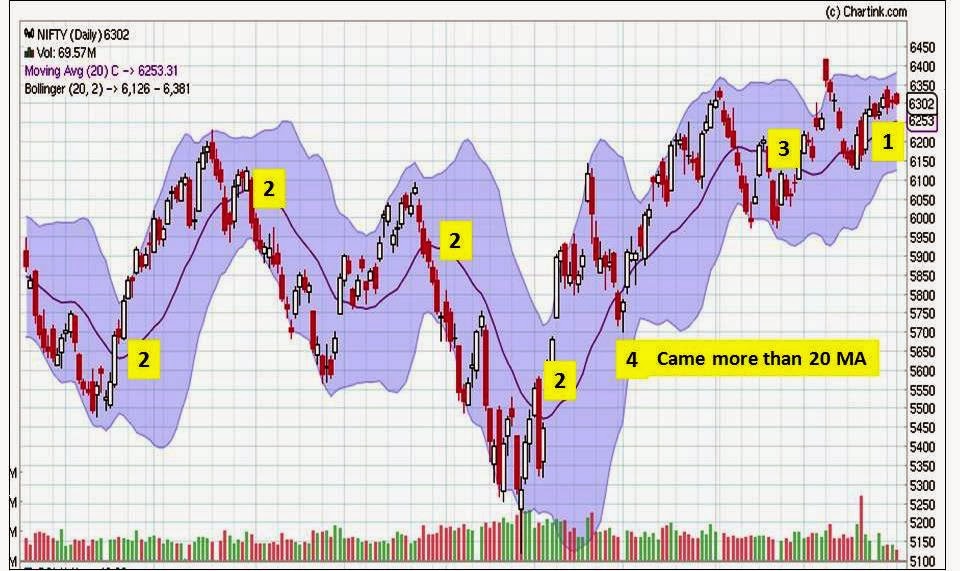
Remember, every damn indicator can work & works, if followed properly. But, every indicator has certain conditions to work. One needs to master few of them only, not over analyzing & paralyzing their decisions.. Look at the chart below with most important & trusted indicators (current Daily Chart of Nifty) if we can conclude the decision-
1) Nifty above all moving averages & EMAs (important ones) - means  UP/ Sideways (in case 1 MA is above)
2) MACD yet to cut down - means UP
3) RSI coming down from overbought zone - DOWN
4) Stochastic clearly DOWN
5) Trendlines - UP
6) Patterns - Rising Wedge - DOWN,  a small inverse H&S - UP & with a target
7) Price action - Higher Highs, higher lows - UP

so which will work & constitute Strong Setup ?  get off the screen & Think for a while below things-
1) Can all indicators/ patterns tells truth?
2) Are indicators really important?
3) Do they Lag?
4) Do we need 1 / 2 or 5 indicators along with PA, trendline...?

----------------------------------------------------
I will come straight to the point -
1) Can all indicators/ patterns tells truth? - Yes, they need to get Interpreted properly. One should use indicators as per traders personality - Example - I  use & Love Bollinger Bands
2) Are indicators really important? - for Positional definitely need to see few & good tool for conformation in Intraday also
3) Do they Lag? - may or may not - like Bollingers & RSI - they don't lag as much as people says.
4) Do we need 1 / 2 or 5 indicators along with PA, trendline...? - One or at the max 2 are enough for use.
Remember, Indicators tell a lie, but they don't lie together!

Anybody can go ahead with any indicator/ without indicator, but i would like to continue this journey with Price action & Bollinger Bands !!

to be continued..


Friday, 27 June 2014

Bollinger Bands (BB) - Hammer/ Stars

15 min BB & Hammer, A Big thing for me..

I Like simple things. The thing which have worked 80% of time for me is a Hammer on BB, but the BB should be either on 15 min chart for Intraday or on Weekly chart for Positional trading.
15 min time frame (TF) is what i also keep an eye on in addition to 5 min TF. If I will choose a single rule for Day trading, this is it for me..

But few Ground rules -
1) Context must be Favourable, at least not opposite.
2) It should be a Tag on BB.
3) Hammer only needs to look like hammer, no criterion for 2/3rd close etc. It should just display that Buyers/ Sellers have got active.
4) Colour of Hammer Matters to set Entry & Targets.
5) Do look for Space/ Fluids.

Addons :
1) If  > 1 hammer spotted, Better !!
2) Lesser the number of candles on Left side of Hammer, Better !!
3) If Coincides with DP, Better !!

SL -  2~4 pts below hammer/ any pivot
Exit - As per your rules. My favourite is a Tag on opposite BB in 5 min.

Entry -
1) on Break of Hammer High/ Low
2) If retraced before breaking Hi/Lo, wait till it touches 50% of Hammer, then enter at any Bullish/ Bearish candle.

Now lets see how it looks with examples:-
1) Today's Inverted Hammer coincided with BOF in 5 min. Could be entered at 50%

2) Few days back - 2 Trades with good signals for Intraday

3) Hammers & that too twice on LBB, then a Star on UBB
4) Weekly Chart- Star on LBB , then 2 Hammers, then a Hammer worked. A Star on UBB that didn't work (See, too many candles on left side of Star).
Now Grab some charts & enjoy the weekend. 
Remember, Nothing works 100% &  Not the Car, but Driver wins the Race !!

Wednesday, 1 January 2014

Bollinger Bands (BB) - Rule 4

Judging the Price with its approach towards BB

95% of all traders never go beyond their first trial with BB & never discover the true power that BB has to offer.

Funny thing about BB is that the reversal and the continuation set-ups are identical. In my opinion this is what frustrates most traders and this is why they never make it with BB. They have a hard time with the fact that they misread whether a continuation or reversal set-up is forming and they more often than not get on the wrong side of the trade.

Now, after going through the last 3 rules, go for this one.. With this we can decide, whether to sit in any trade for more Profits or get out with BB as exit !!

Observe how the bands react to Approaching Price Action.. The key to your falling in love with BB is careful observation of how the bands react to approaching price action. "Both bands" not just the one being approached..
We'll use Bullish reversal's and continuations for this example in the Nifty Daily Chart and the opposite is true for bearish reversals or continuations. The points are marked by numbers in Picture. Ready by looking at the graph for better understanding-

1.) Price approaches the UBB and the UBB goes up and the LBB is flat or moving up slightly. Continuation - Price will likely continue up slowly for a time.
2.) Price approaches the UBB and the UBB goes up and the LBB goes down. Continuation - Price will likely move up fast and furious. This is the best continuation pattern for the bands. This is a rapid expansion of volatility. You will experience "fake out's" sometimes but most of the time this set-up will produce some good profits when executed properly.
3.) Price approaches the UBB and the UBB and LBB remains flat. Reversal - Likely a sharp reversal to the lower band. Because both bands are flat this will likely be short lived.
4.) Price approaches the UBB and the UBB and LBB both go down. - Reversal - This is likely to result in a reversal but keep in mind price will likely only make it to the mean, the 20 MA with both bands heading down like this. This is a rare occurrence and is typical of a bigger market swing. A transition from Bullish to Bearish conditions.


Now, pull up 10 ~ 20 charts and spend some time observing how the bands react to approaching price action. My guess is when your done you'll likely take BB out on her long overdue second date..  which can change your trading..

Monday, 9 December 2013

Bollinger Bands (BB) - Rule 3

Third Rule of BB - Close/ Tag or No touch on BB

Ok, here comes another good rule for BB, which i use most of the time. Its a little tougher & needs practice to watch at Live market. So, keep identifying it first at daily charts- then on hourly TF & finally on hi speed 5min/ 3 min charts..

BB are nothing but the standard deviations & in Technical terms, when a process moves outside this band, it will turn to its mean IF ANY EXTERNAL INTERFERENCE forces the process. This External Interference is generally the Smart Money & it is shown by the Close / Tag or No touch on BB..

Close means, no Interference, so market will most probably continue the same direction after Pullback
Tag means, some External Interference & a pressure to not let the Process deviate the other trend
No Touch is nothing but Failure to Continue & even touch the BB, a good Pressure for Reversal.

Lets see with below example to understand all 3...

So keep looking for them and decide on the position, whether to exit or take reversal..

NB: The order should be right at a DP - 1) Close then 2) Tag and 3) FTC. Not in reverse order...

Happy Trading !!!

Tuesday, 26 November 2013

Bollinger Bands (BB) Rule 2 (Reversal)

Second Rule of BB.. Pay attention to Hammer/ Stars on BB

One of my simple rule to find out a reversal is to find a Hammer at Lower BB or a Shooting Star at Upper BB. But always remember, in all the cases, we let the mid BB flatten.

That means we don't take the first reversal of BB after any Range breakout. We trade 2nd/ 3rd reversal signal on Lower BB & 3rd reversal signal on upper BB. This is due to the fact that reversal from Uptrend generally takes time, so we generally take 3rd reversal sign. Better to miss a trade then to be in a Bad one.

See my below trade as an example on 11.11.2013. After range breakout, 1st & 2nd reversal candles left. Took 3rd reversal at the marked place..


Reading BB is an art. Read it with Candlesticks but no need to remember the technical names of the candles. When we see a candle & tell to our self that people are buying/ selling or are in indecision, it's enough. We are trying to read the sentiments from candles.
Also, we need to wait for the second candle (one candle makes fool generally) & of course near to our DP.

Sunday, 24 November 2013

Bollinger Bands (BB) - Rule 1

First Rule of BB..  Pay Attention to the 20 MA (Mid BB)

Although, this is one of the rule of my rules, I follow to Day trade. You need to combine it with your other rules..

So, whatever Timeframe you use, You need to initiate your trade only in the direction of 20 MA (Mid BB). When its Up, you need to Buy & when its Down, you need to Sell only. The Flat mid BB suggests to Buy/ Sell on the touch to the BB extremes.

I know, this is a Simple rule & people don't follow simple rules. Human mind believe complicated things more over simple ones and try to find out a way in which simple systems don't work. But Trading is a Probability Game. This simple rule will ensure increase in the Probability of success.

No Index/ Stock can stay much away from its 20 MA. It's also used by majority of traders and place their SL above/ below it. So consider another factor of Order flow above/ below it.

See the below trades of 22.11.2013 and look at the mid BB just before the entry. Include this simple rule in your Arsenal & feel the difference..